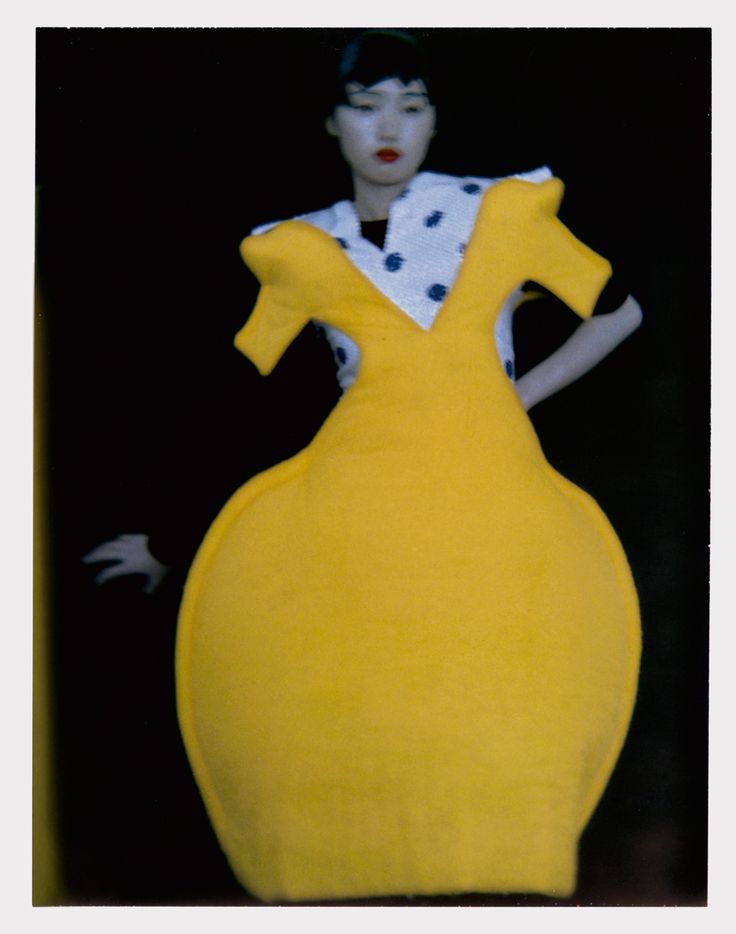
I have chosen an image taken by Irving Penn in 2005.
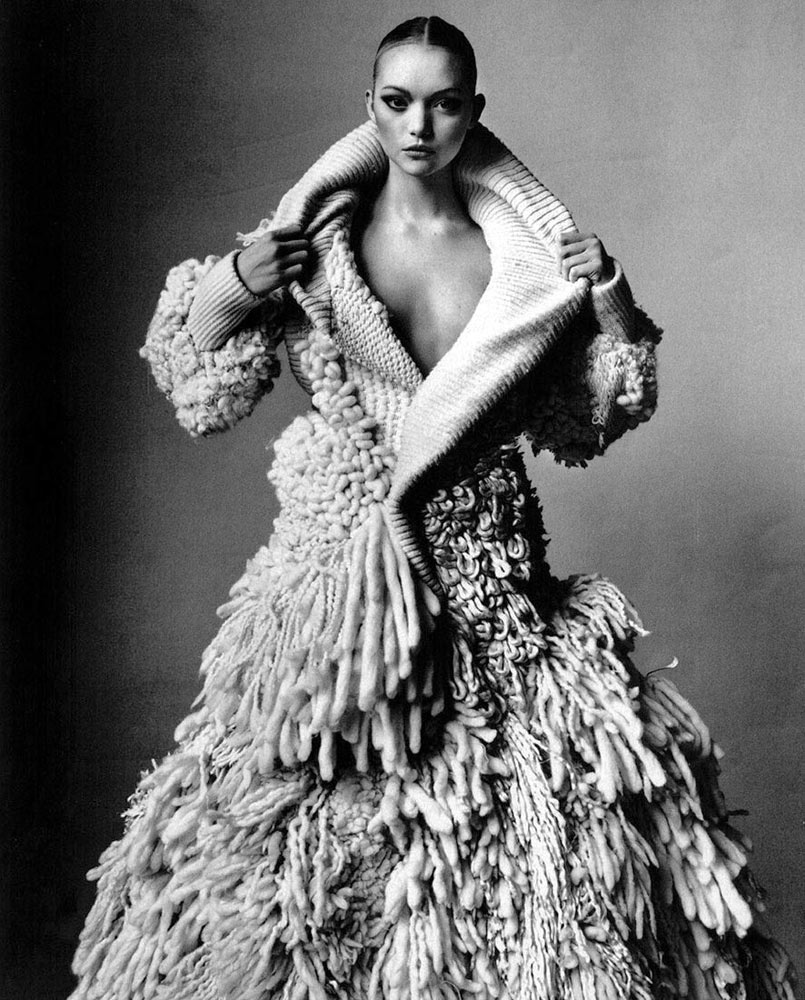
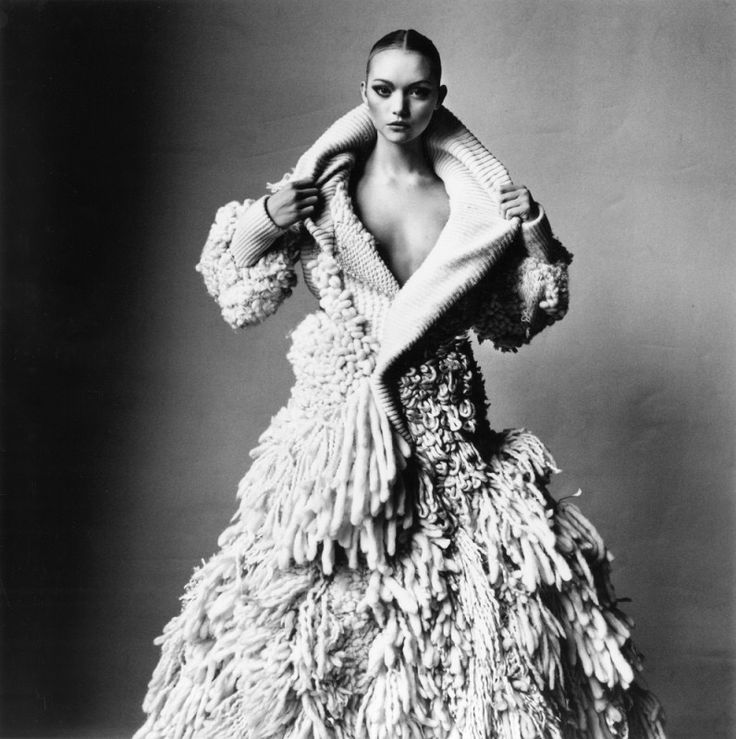
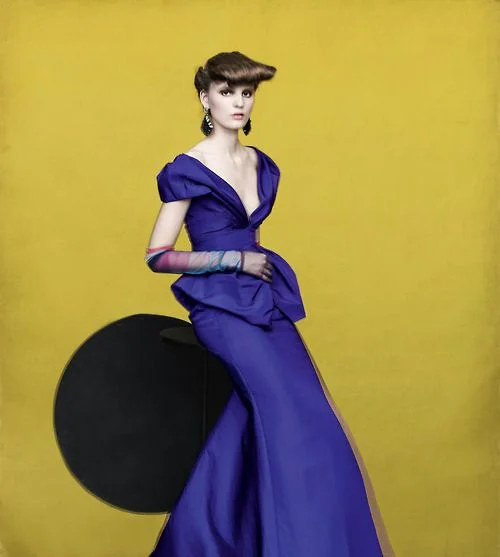
Balenciaga Yeti Coat (A), By Ghesquiere, New York, 2005
Gelatin silver print mounted to board
10 1/4 x 10 1/4 in., Edition of 7
© The Irving Penn Foundation
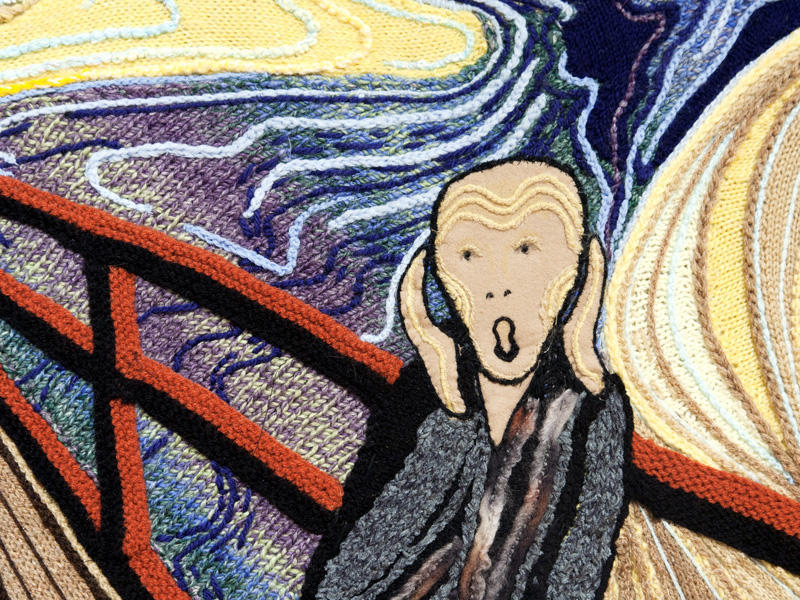
- The silhouette of this particular piece is very full and indistinct, as it appears to be made from many individual strands of bulky wool. The textiles look to be soft and probably trap warm air close to the body, keeping the wearer warm in colder weather. The Yeti Coat is full length and features a wide collar like a cowl. The bulky fibres that make up much of the coat do not appear appear around the neck or at the ends of the sleeves, probably to allow for freedom of movement and to avoid irritating the wearer. The presentation of the coat exaggerates the wearer's size and makes the body seem large and imposing—it is a striking garment.
- Because of the bulky materials used for most of the coat, its volume is considerable and the garment looks as though it would be heavy. This could be deceptive, depending on the materials used to make the coat—if this is wool (as it appears to be), it would be a very heavy piece to wear. It would probably not be suitable for a shorter person to wear, because the volume would be unflattering without the necessary height to give it scale. This is a garment for a tall, confident and—ideally—slim person who can carry off the look without appearing to be overwhelmed by it.
- Again, because of the seeming weight and bulk of the materials used, the drape of the coat is heavy and does not conform easily to the shape of the body, as a filmier fabric might. Instead, the garment conceals much of the shape of the body, although it is much fuller at the bottom and narrower at the waist which helps to ensure that the wearer's form is not completely lost.
- Because of the weight of the garment, it would likely muffle fine movements by the wearer. Instead, the individual might seem to move as a monolith of wool, perhaps with some subtle shaking of individual strands.
- It is not possible to tell the coat's colour from the monochrome image, but it seems to be uniform and light in tone, without print or pattern. This means that the form of the coat is not broken up but appears as a single unit, with the only exceptions being the absence of heavy strands at the neck and sleeves. At the same time, the strands appear to vary in thickness and length, so there is still some variation in appearance that give more visual interest to the Yeti Coat.
Looking at the image as a fashion photograph, it is clear that Penn has used sidelighting effectively to emphasize the garment's form and texture, its most important qualities. The monochrome treatment keeps the focus on this features and does not allow colour to distract the viewer—the image was made in 2005, so a black and white image was a deliberate stylistic choice.
I find the image striking and the coat bold. It is as much a statement about its wearer as it is protection against the cold. I'd be happy to see if being worn on the street this winter but, as I mentioned above, it would need to have the right wearer to carry off the look without looking awkward. For this reason, the choice of model (slim, elongated body) is important and the photographer has helped to break up the chunky look by opening the neck and creating a v-shape the lengthens the neck and highlights the model's face. The model's hair is also swept back, which keeps her hair from competing with the texture of the coat or being lost against it.


![Train Window - Green Pine{车窗-青松]. Zhang Xiaogang 张晓刚2010](https://images.squarespace-cdn.com/content/v1/5224bdefe4b0f7b35c282f4d/1488939247018-YFOP2WCTXKYP4TKMJGKY/55e1ef71-eacf-4603-88f0-e75da8552b87_l.jpg)